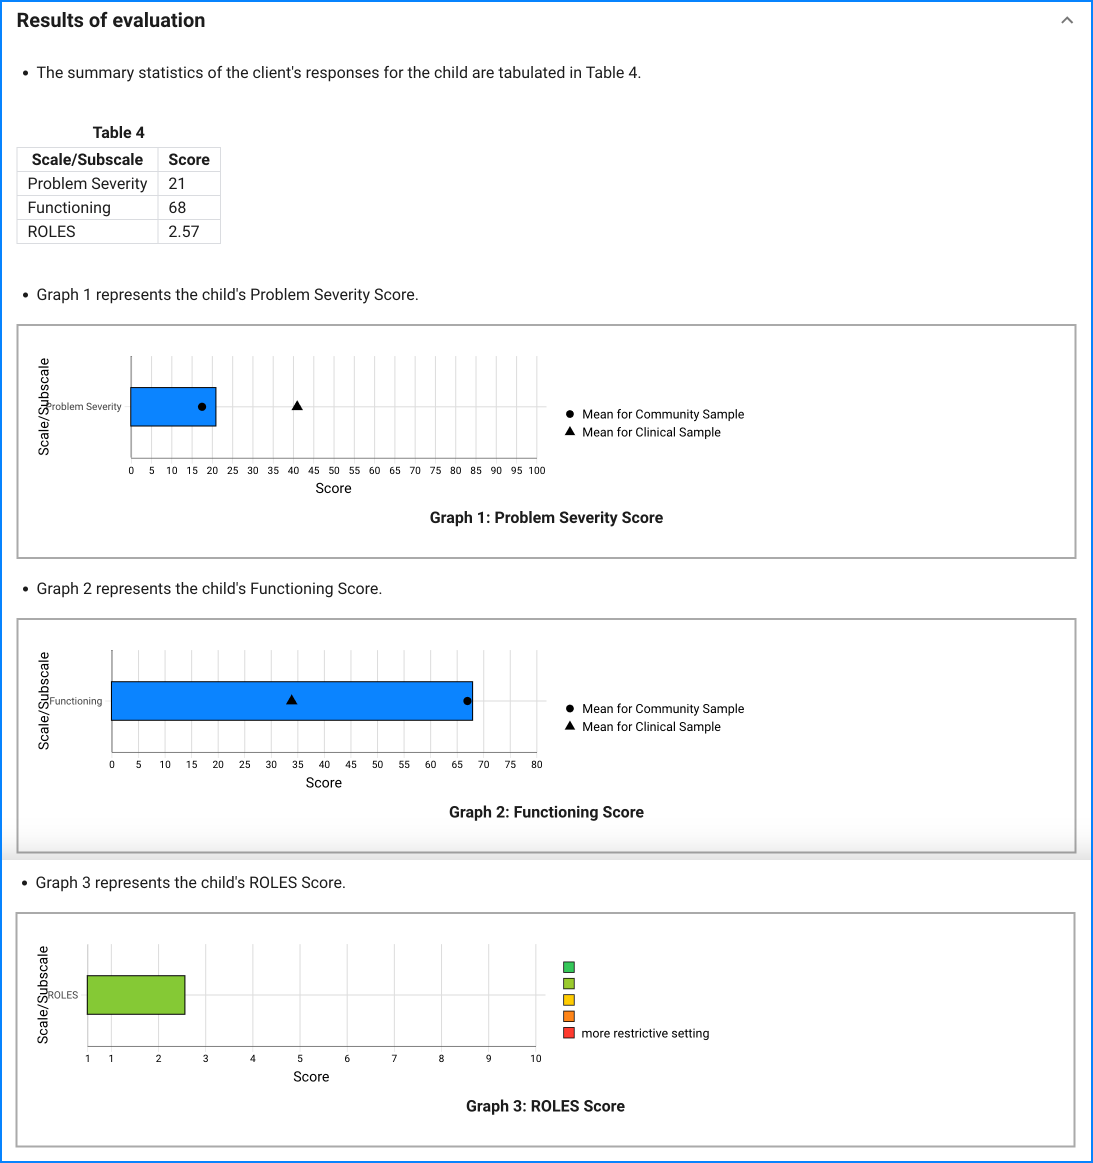
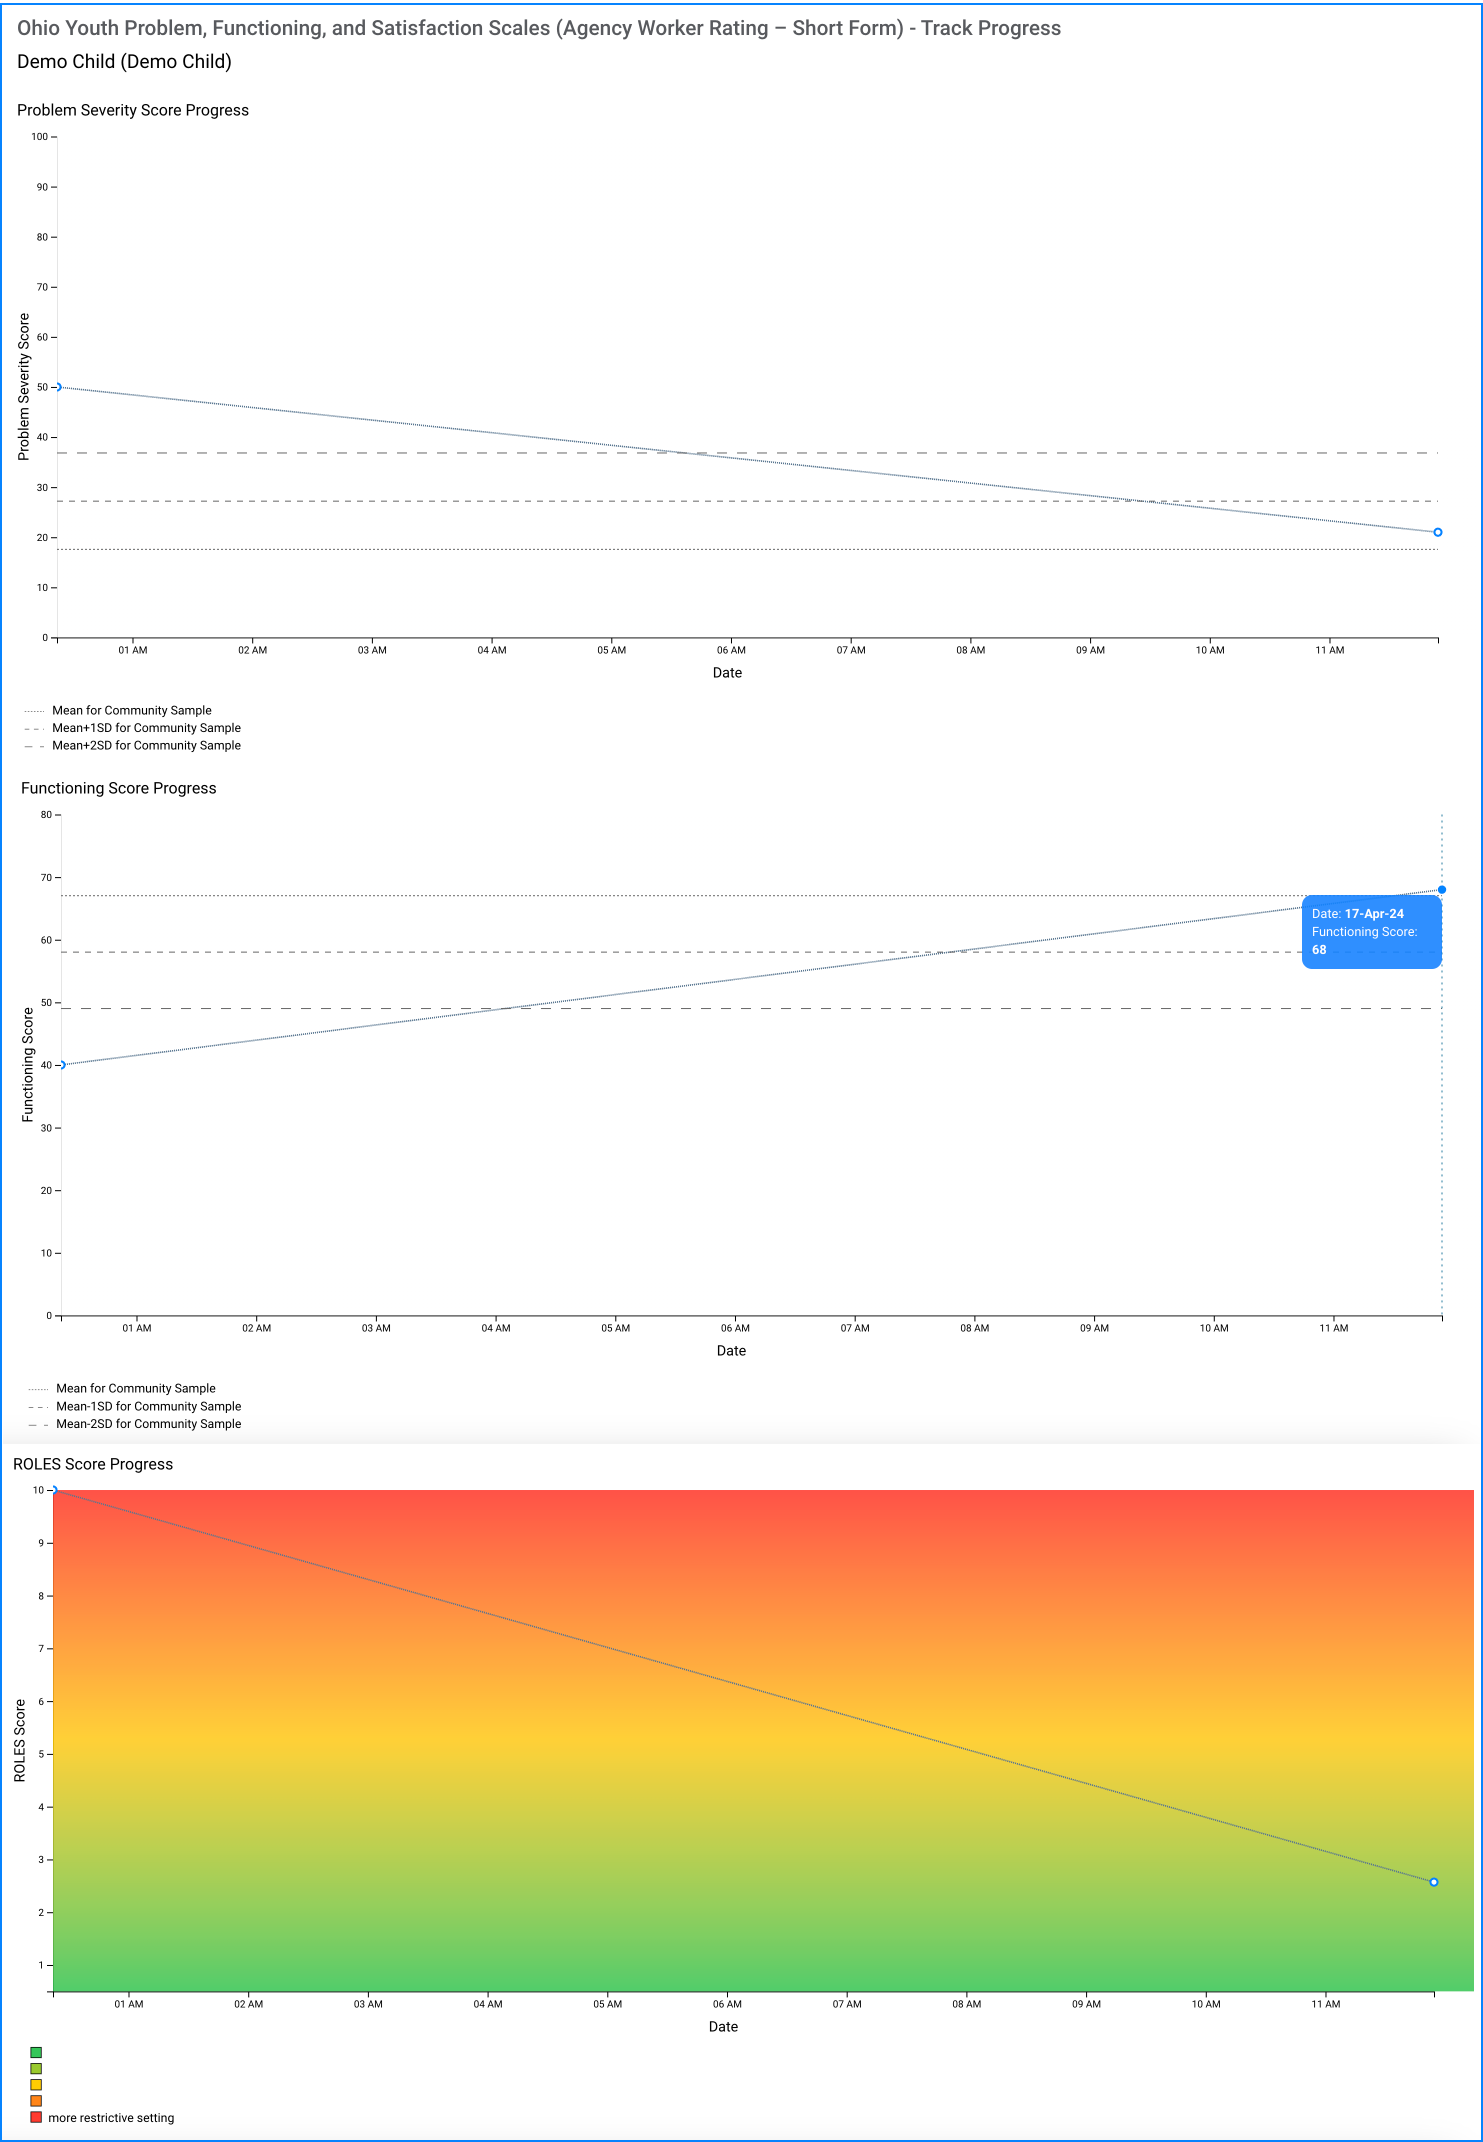
Start delivering measurement based mental health care

Conduct psychological assessments remotely, get scores automatically, and maintain clinical records securely

Create account
Ohio Youth Problem, Functioning, and Satisfaction Scales (Agency Worker Rating – Short Form)

Ohio Youth Problem, Functioning, and Satisfaction Scales (Agency Worker Rating – Short Form)

What is Ohio Scales W-form

The Ohio Scales for Youth are brief measures of outcome for youth receiving mental health services. The scales include a 20 item Problem Severity scale and a 20 item Functioning scale rated from the youth. In addition, the agency worker form also includes the Restrictiveness of Living Environment Scale (ROLES) created by Hawkins et al. (1992) and several indicators of outcome.

Ohio Scales W-form Printable PDF

You can create a free account on PsyPack to access fillable PDFs, manuals and educational resources for the Ohio Scales W-form

Ohio Scales W-form Scoring and Interpretation

Problem Severity

All three forms include the 20 item problem severity scale. Each of these items is rated on a 6-point scale for frequency during the past 30 days: not at all, once or twice, several times, often, most of the time, or all of the time. The columns for each frequency are coded respectively from 0 (Not at all) to 5 (All of the Time). Each column's score can then easily be added at the bottom of the page. The sum of the six columns then becomes the individual's score on the problem severity scale. No items are reverse-scored.

Functioning

The functioning scale total is calculated in the same manner used on the problem severity scale. Each of the 20 items is rated on its 5-point scale. The rating for each item is circled. The columns for each frequency are coded respectively from 0 (extreme troubles) to 4 (doing very well). Each column's score can then easily be added at the bottom of the page. The sum of the five columns then becomes the individual's score on the functioning scale. No items are reverse scored.

Restrictiveness of Living Environments Scale (ROLES)

The W-form includes a copy of the ROLES (Hawkins et al., 1986). The ROLES consists of a list of 23 categories of residential settings. Next to each specific setting is a blank line on which the agency worker writes the number of days (during the past 90 days) the youth was residing in that setting (The total of all the days will therefore add to 90).

Each setting is given a statistical 'weight' as listed in below. To get the ROLES total score, each weight is multiplied by the number of days in the blank next to the setting. The sum of these products is then calculated to get a total. The total is then divided by 90 to get the average restrictiveness for the previous 90 days.

Jail 10.0

Juvenile Detention Center 9.0

Inpatient Psychiatric Hospital 8.5

Drug/Alcohol Rehabilitation Center 8.0

Medical Hospital 7.5

Residential Treatment 6.5

Group Emergency Shelter 6.0

Residential Job Corp/Vocational Center 5.5

Group Home 5.5

Therapeutic Foster Care 5.0

Individual Home Emergency Shelter 5.0

Specialized Foster Care 4.5

Foster Care 4.0

Supervised Independent Living 3.5

Home of a Family Friend 2.5

Adoptive Home 2.5

Home of a Relative 2.5

School Dormitory 2.0

Biological Father 2.0

Biological Mother 2.0

Two Biological Parents 2.0

Independent Living with Friend 1.5

Independent Living by Self 0.5

Means and Standard Deviations on the Ohio Scales for Community and Clinical Samples.

Table 5
Population: FormNProblems M (SD)Functioning M (SD)

Community: Agency Worker

40

17.58 (9.62)

67.03 (9.01)

Clinical: Agency Worker

134

41.04 (14.40)

33.94 (12.91)

A high score on the problem severity scale is considered to be more problematic (more frequent problems).

Responses other than ‘Not at All’ on these Problem Severity scale items deserve immediate attention:

7. Using drugs or alcohol

8. Breaking rules or breaking the law

12. Hurting self (cutting or scratching self, taking pills)

13. Talking or thinking about death

A low score on the functioning scale is considered to be more impairment.

The Restrictiveness of Living Environments Scale (ROLES) assesses the level of restrictiveness for the youth's placements during the past 90 days. A higher score means on average the youth is placed in a more restrictive setting.

PsyPack can automatically score the Ohio Scales W-form assessment and prepare corresponding tables and graphs.

Ohio Scales W-form sample result

Further, PsyPack automatically plots a graph to help you easily track progress over time.

Ohio Scales W-form track progress

Sample Report of Ohio Scales W-form

Domain

Problem Severity, Functioning, Restrictiveness of Living Environment

What does Ohio Scales W-form measure

The purpose of the evaluation is to:

  • measure outcomes for youth receiving mental health services, and
  • assess the level of restrictiveness for the youth's placements during the past 90 days.

Administration

Agency Worker-Rated

Type of outcome tool

Clinical

Assessment modes

Questionnaire

Age and eligibility

5 to 18 years

Estimated time

About 10 minutes

Notes

Since the questionnaire relies on client's observations, all responses should be verified by the clinician, and a definitive diagnosis is made on clinical grounds taking into account how well the client understood the questionnaire, as well as other relevant information from the client.

The Ohio Scales can be used:

  • As a tool for clinicians, youth, and family members to use in treatment,
  • To provide accountability to ensure consumer’s needs are met efficiently and effectively, and
  • In quality improvement activities of agencies and boards to help focus on what works.

THE OHIO SCALES CAN ADD VITAL ASSESSMENT AND TREATMENT PLANNING INFORMATION.

  • Focus on the critical items of the Ohio Scales that may not be reported anywhere else. Responses other than ‘Not at All’ on these Problem Severity scale items deserve immediate attention: 7. Using drugs or alcohol, 8. Breaking rules or breaking the law, 12. Hurting self (cutting or scratching self, taking pills), 13. Talking or thinking about death. Youth know more about these areas than parents or clinicians. Setting the right tone and showing interest in the youth’s welfare can help youth be more open.
  • Identify areas where the clinician, parents and youth see things differently. Significant differences between parent and youth responses may predict poor treatment outcomes. In these cases, special attention needs to be given to building the therapeutic alliance. Sometimes the worker’s score is discrepant, particularly for the initial assessment. Discussing differences in scores are one method for determining the goals of treatment.
  • Identify specific strengths in individual items from each scale to build the treatment plan. All youth have positive attributes to build on! High scores on Functioning scale items and low scores on Problem Severity scale items indicate strengths. Additionally, Hopefulness scale items can be viewed as strengths, as hope is a key component to getting the most out of treatment. Clinicians and families can use the Strengths report to identify all of the strengths found on the Ohio Scales. Raw data, however, can serve the same purpose.
  • Identify specific areas that may serve as targets of treatment. While the family may readily identify a target for treatment, it’s important to have measures of those targets. The items on the Ohio Scales are often selected as targets of treatment. High Problem Severity scale items are easy to identify and are appropriate targets. Low Functioning scale items can also be appropriate targets for treatment, as improving functioning can help build capacity within youth. If your agency has “Red Flags” reports, use them to identify the targets.

THE OHIO SCALES CAN BE USED TO MONITOR AND MODIFY TREATMENT BY GIVING AN “OBJECTIVE” VIEW OF HOW TREATMENT IS PROGRESSING.

  • Compare current Ohio Scales Scores with previous scores. How do you know if treatment is working? Observed changes on the Ohio Scales from intake to the most current assessment can indicate how treatment might be improved. Scores may get worse, especially from intake to three months. The decrease in scores could be from poor treatment, worsening condition, more insight into the illness, or other reasons. In any case, you may want to use the lower of the intake and three­ month scores as the baseline for subsequent comparisons.
  • Check if Reliable Change has occurred. When a scale score changes by a certain amount, that change is deemed to be a Reliable Change. Changes of eight or more on the Functioning scale, 10 or more on the Problem Severity scale, and six or more on the Hopefulness scale are considered a Reliable Change. Reliable Change can be in a positive direction, which is reason to think that treatment is working. Reliable Change in a negative direction is an indicator that treatment should be reviewed. Lack of any Reliable Change can indicate that treatment has not been effective.

THE OHIO SCALES CAN BE USEFUL AS ANOTHER SOURCE OF INFORMATION ABOUT DISCHARGE PLANNING.

  • Decide if Clinical Significance has been achieved? Clinical Significance means a positive Reliable Change has occurred, and the score has moved from the “clinical” range to the “non­ clinical” range. For the Functioning scale, the non­clinical range is 50 and up; for the Problem Severity scale the non­clinical range is 20 and below. Clinical Significance, or the failure to reach it, cannot be the sole indicator for readiness to end treatment. Clinically Significant Change is one more important data source to use when considering ending treatment. The Change Over Time Report can show Clinical Significance.

THERE ARE SOME WAYS TO USE THE DATA THROUGHOUT THE COURSE OF TREATMENT THAT WILL HELP.

  • Turn it sideways! The Functioning and Problem Severity scales are positioned on paper forms so that when the completed form is turned sideways, elevated scores are higher on the page. The first 11 items on the Problem Severity scale are “Externalizing” (something one can observe in a youth), and items 12­-20 are “Internalizing” (something that only the youth can know). Turning the form sideways makes it easier to view and understand the data. If you're reviewing a PsyPack-generated report, simply check the color-coded response sheet to spot elevated scores easily.
  • Review the Ohio Scales periodically. Families and clinicians reviewing and discussing the Ohio Scales together in the first treatment session is a good way to set a course for treatment. Using the Ohio Scales in treatment is appropriate and is billable!
  • Document treatment plans and progress! Documentation is required, and the Ohio Scales data should be reflected in assessment, treatment plans, and progress notes. Families can record and track their own outcomes, which may help identify progress or the lack of progress.

Attribution and References

Benjamin M. Ogles, Hawkins et al., 1986