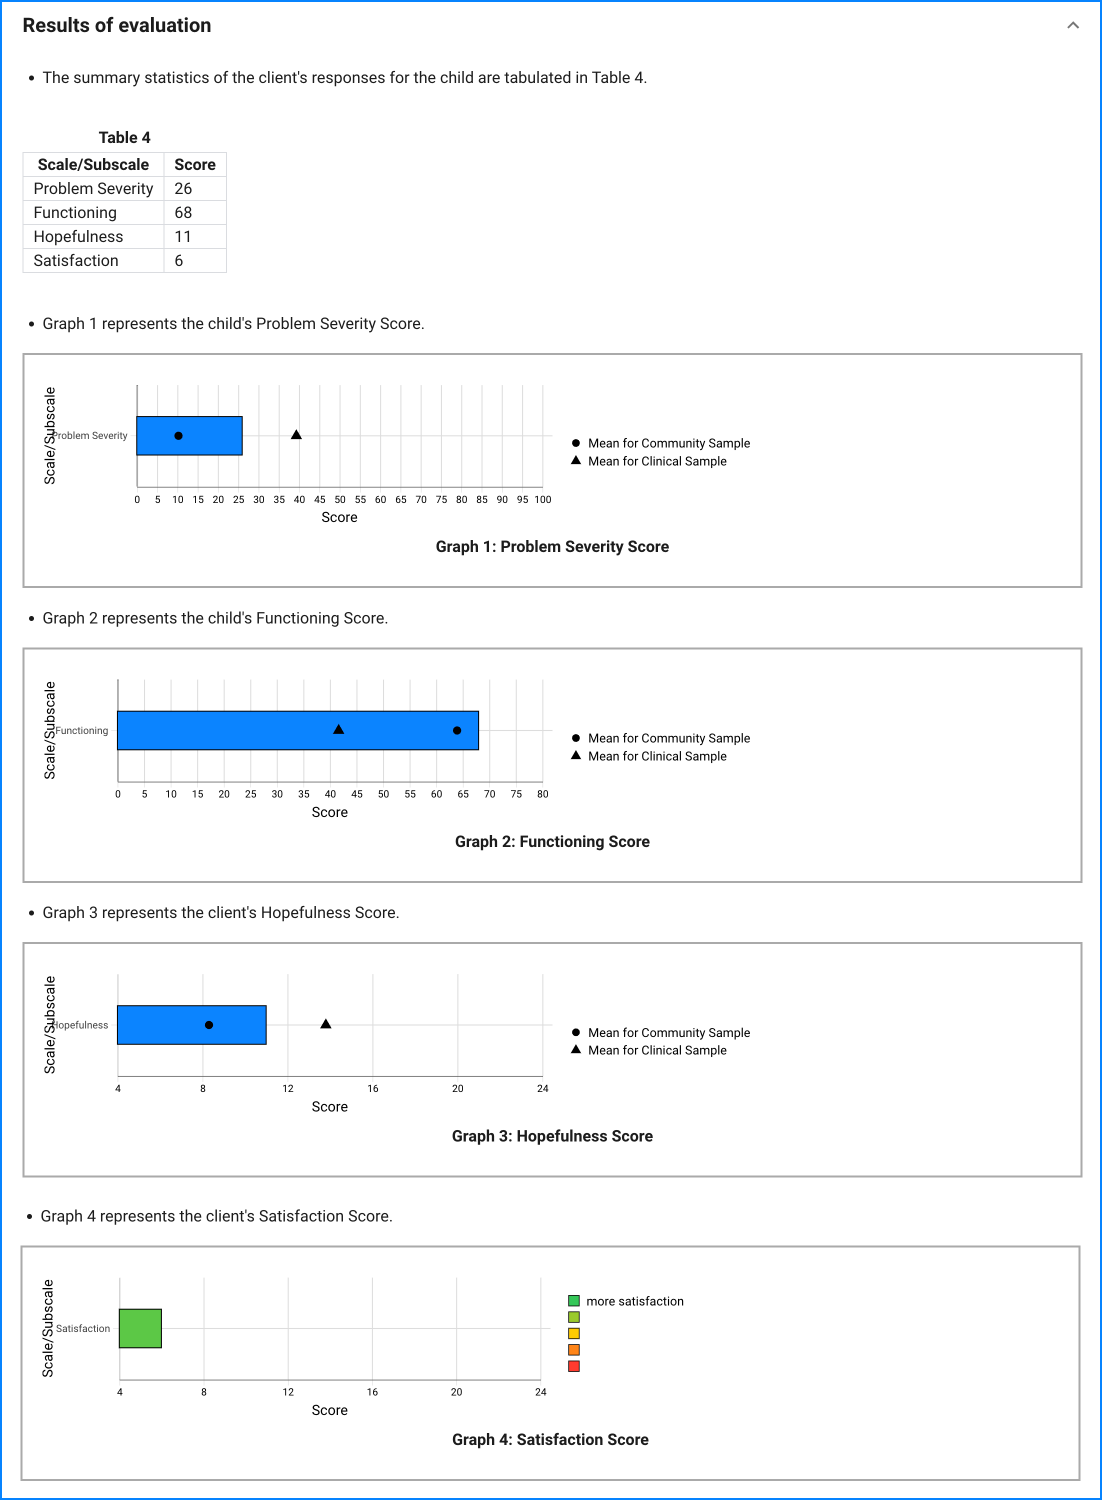
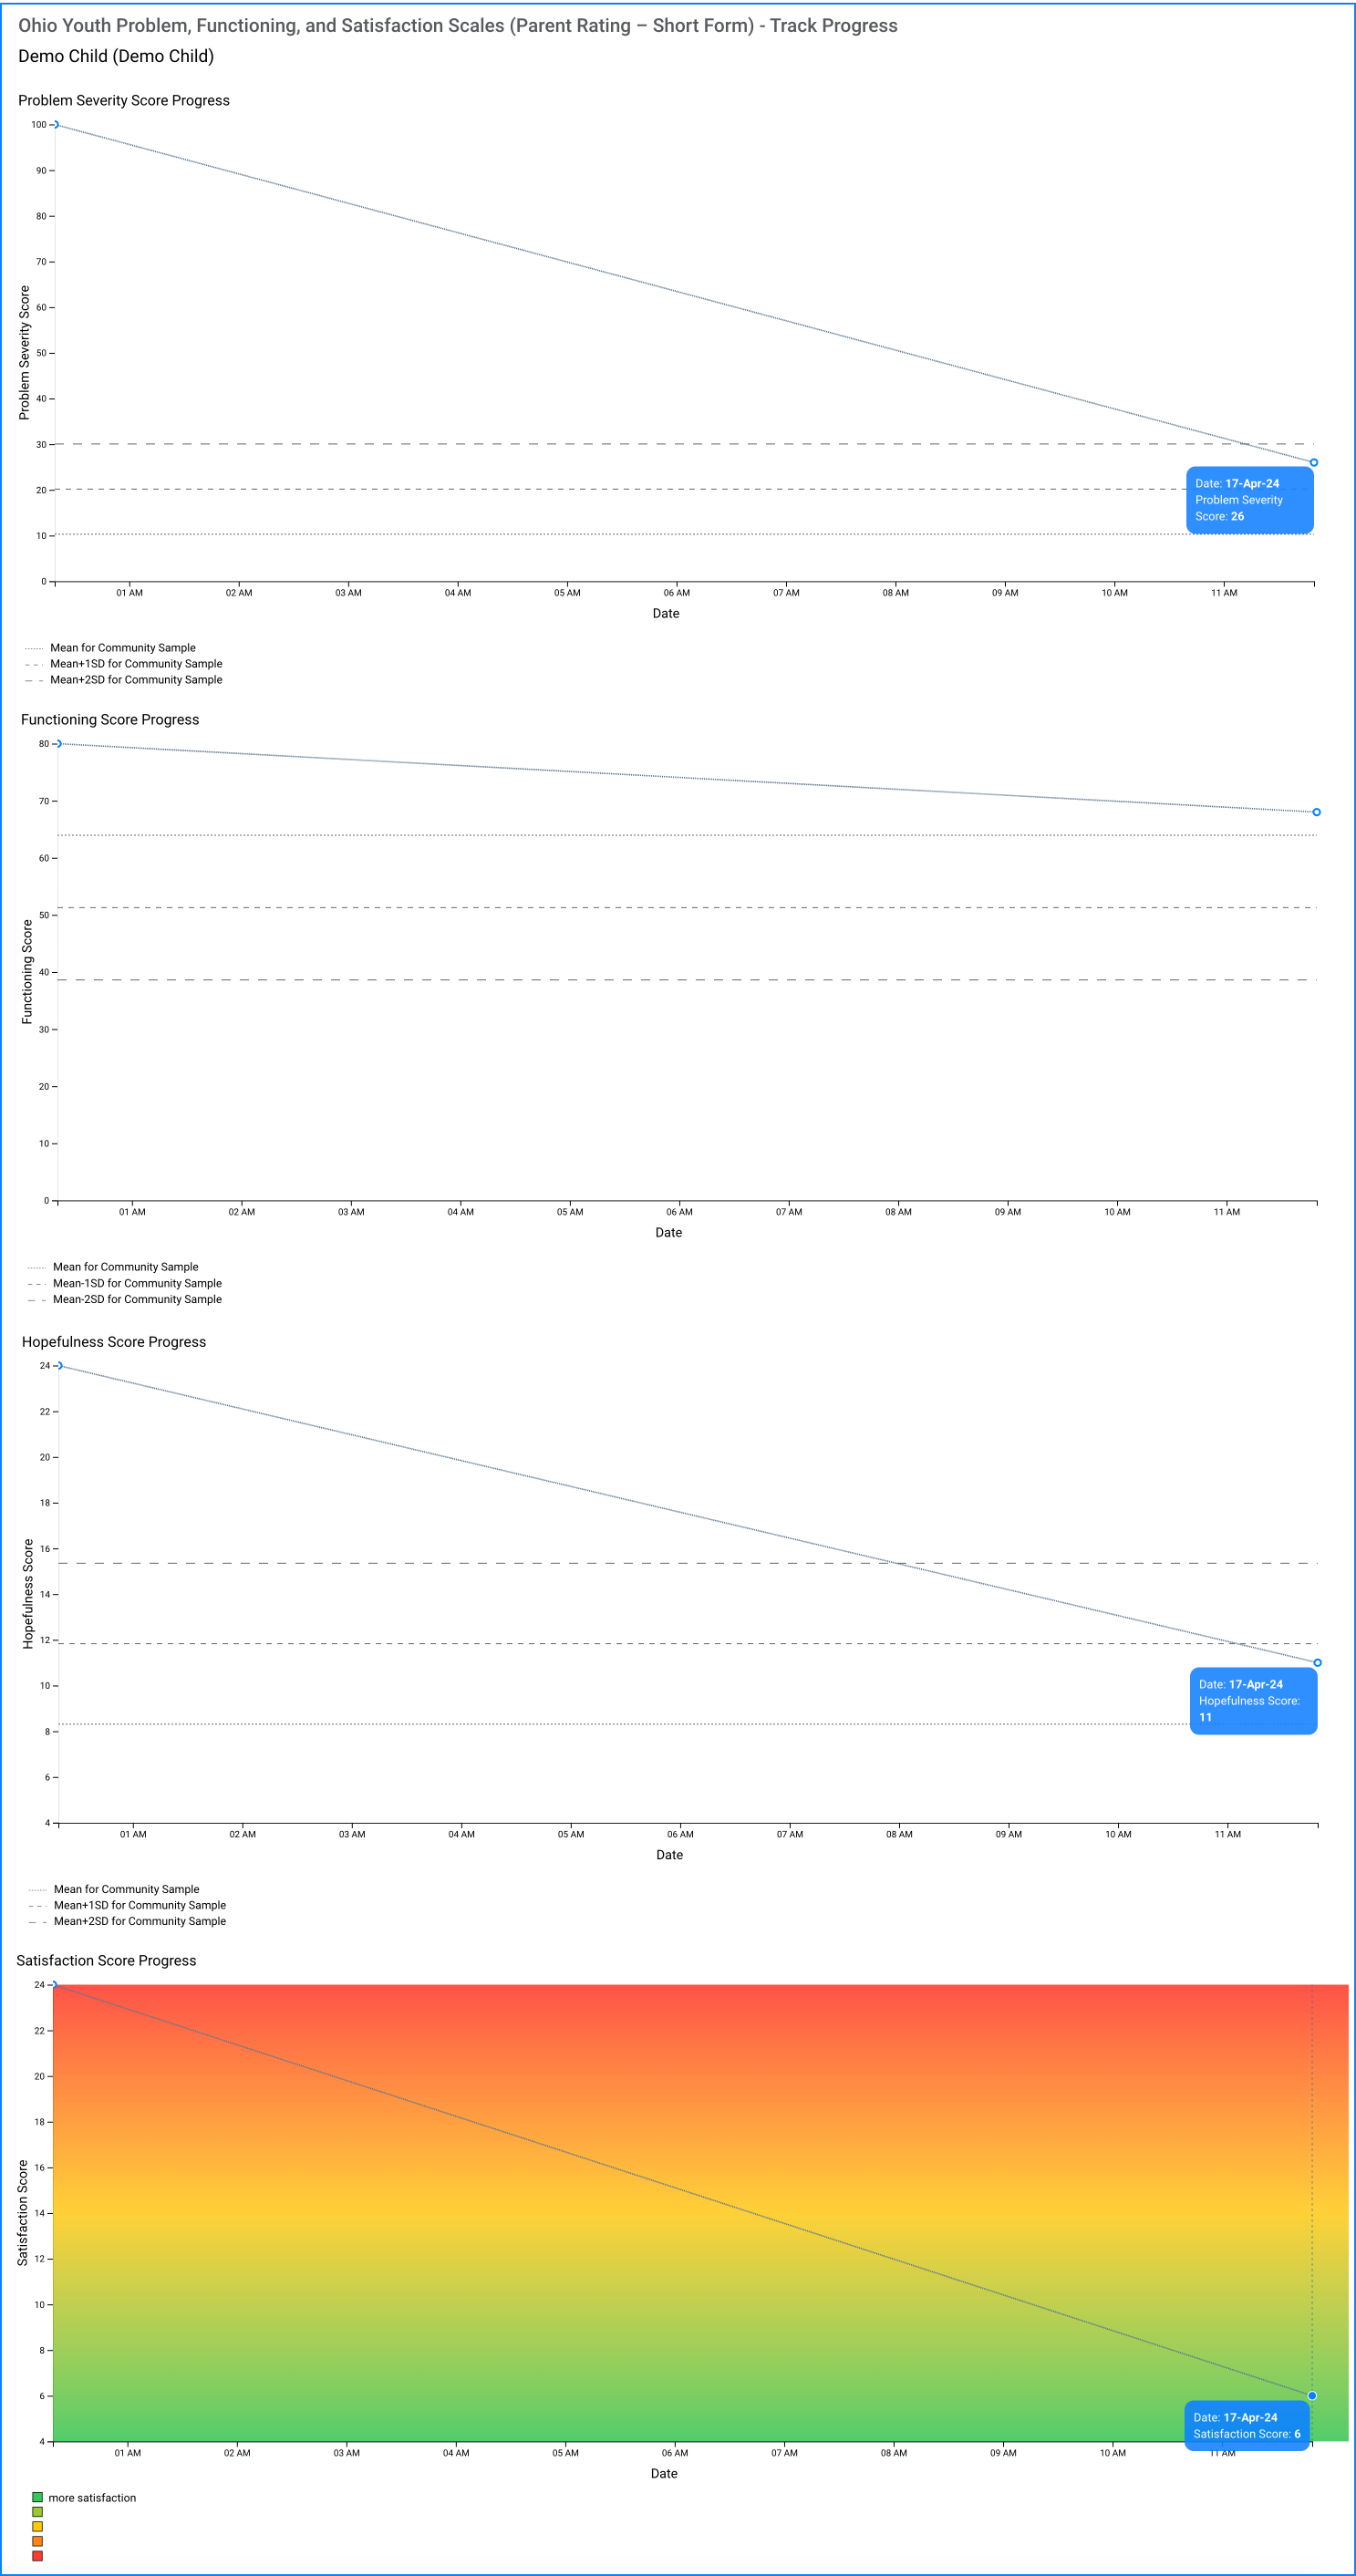
Problem Severity
All three forms include the 20 item problem severity scale. Each of these items is rated on a 6-point scale for frequency during the past 30 days: not at all, once or twice, several times, often, most of the time, or all of the time. The columns for each frequency are coded respectively from 0 (Not at all) to 5 (All of the Time). Each column's score can then easily be added at the bottom of the page. The sum of the six columns then becomes the individual's score on the problem severity scale. No items are reverse-scored.
Functioning
The functioning scale total is calculated in the same manner used on the problem severity scale. Each of the 20 items is rated on its 5-point scale. The rating for each item is circled. The columns for each frequency are coded respectively from 0 (extreme troubles) to 4 (doing very well). Each column's score can then easily be added at the bottom of the page. The sum of the five columns then becomes the individual's score on the functioning scale. No items are reverse scored.
Hopefulness
On the back side of the parent and youth versions, eight questions are printed at the top of the page. The first four questions ask for ratings of hopefulness (parent) or overall well being (youth). The specific questions vary somewhat on the two versions to fit the respondents. Each question is answered according to a 6-point scale with the specific scale items varying to fit the questions. In each question, response "1" is the most hopeful/well and response "6" is the least. The four items can then be totaled for a hopefulness scale score. On this scale, a lower total means more hope or wellness.
Satisfaction
The second four questions on the top half of the back page (P-form and Y-form) ask for ratings of overall satisfaction with behavioral health services received and ratings of their inclusion in treatment planning. The specific questions vary somewhat on the two versions to fit the respondents. Each question is answered according to a 6-point scale with the specific scale items varying to fit the questions. In each question, response "1" is the most satisfied/included and response "6" is the least. The four items can then be totaled for a satisfaction scale score. On this scale, a lower total means more satisfaction.


