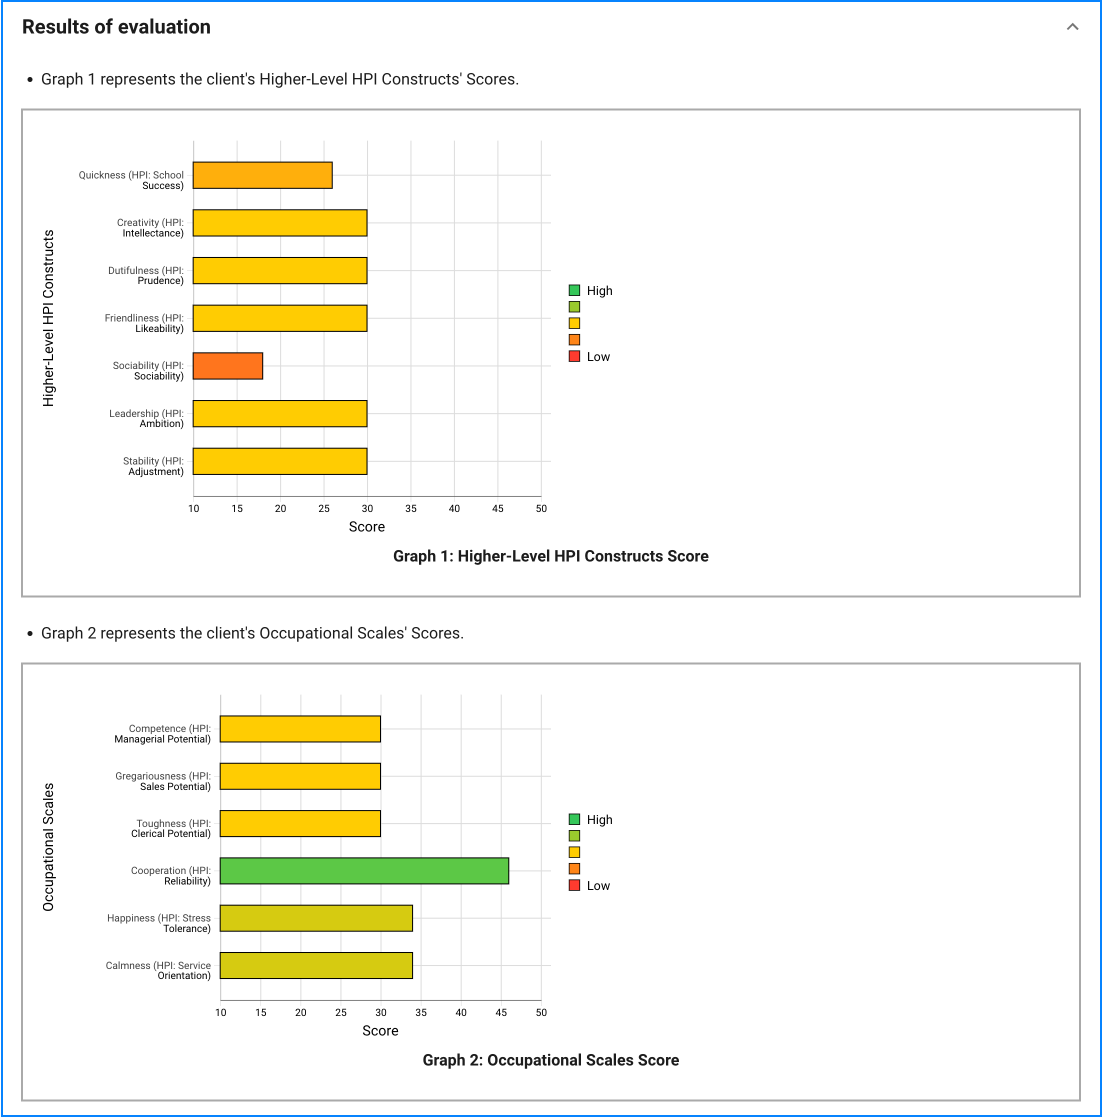
To interpret individuals' scores, one might calculate the mean and standard deviation (SD) for a sample of persons, usually of the same sex and a particular age range, and interpret scores within one-half SD of the mean as "average." Scores outside that range can be interpreted as "low" or "high." If the scores are normally distributed, this would result in approximately 38% of persons being classified as average, about 31% as low, and 31% as high. IPIP recommends computing means and standard deviations in one’s own sample.
One should be very wary of using canned "norms" because it isn't obvious that one could ever find a population of which one's present sample is a representative subset. Most "norms" are misleading, and therefore they should not be used.
Far more defensible are local norms, which one develops oneself.
One should try not to pigeon-hole individuals into type categories like introvert and extravert, given that introversion-extraversion is a continuum. Most research studies can use continuous statistical analyses of the full range of scores, such as some form of regression analysis. And even when one provides feedback to participants, one can show them where their scores lie on the full continuum of scores rather than telling them what type of person they are. In short, we caution against interpreting IPIP scale scores in terms of categories or sorting respondents into groups based on their score.


