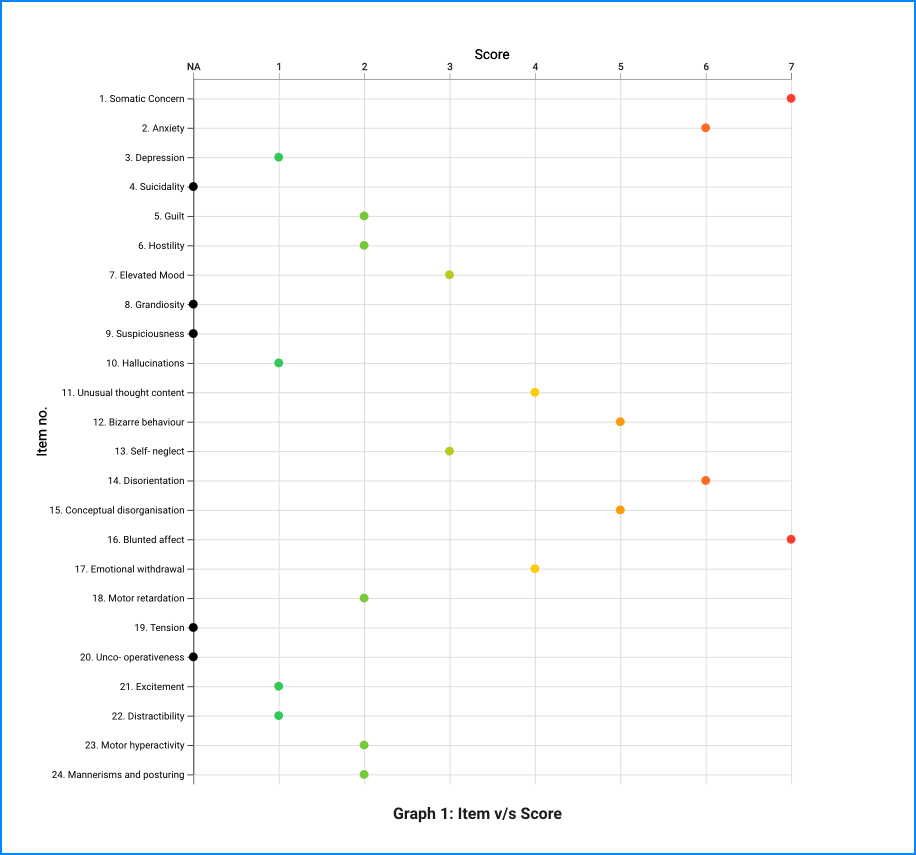
The BPRS-E consists of 24 symptom constructs. The rater should enter a number ranging from 1 (not present) to 7 (extremely severe). 0 is entered if the item is not assessed.
Total BPRS-E Score = Sum the scores from the 24 items.
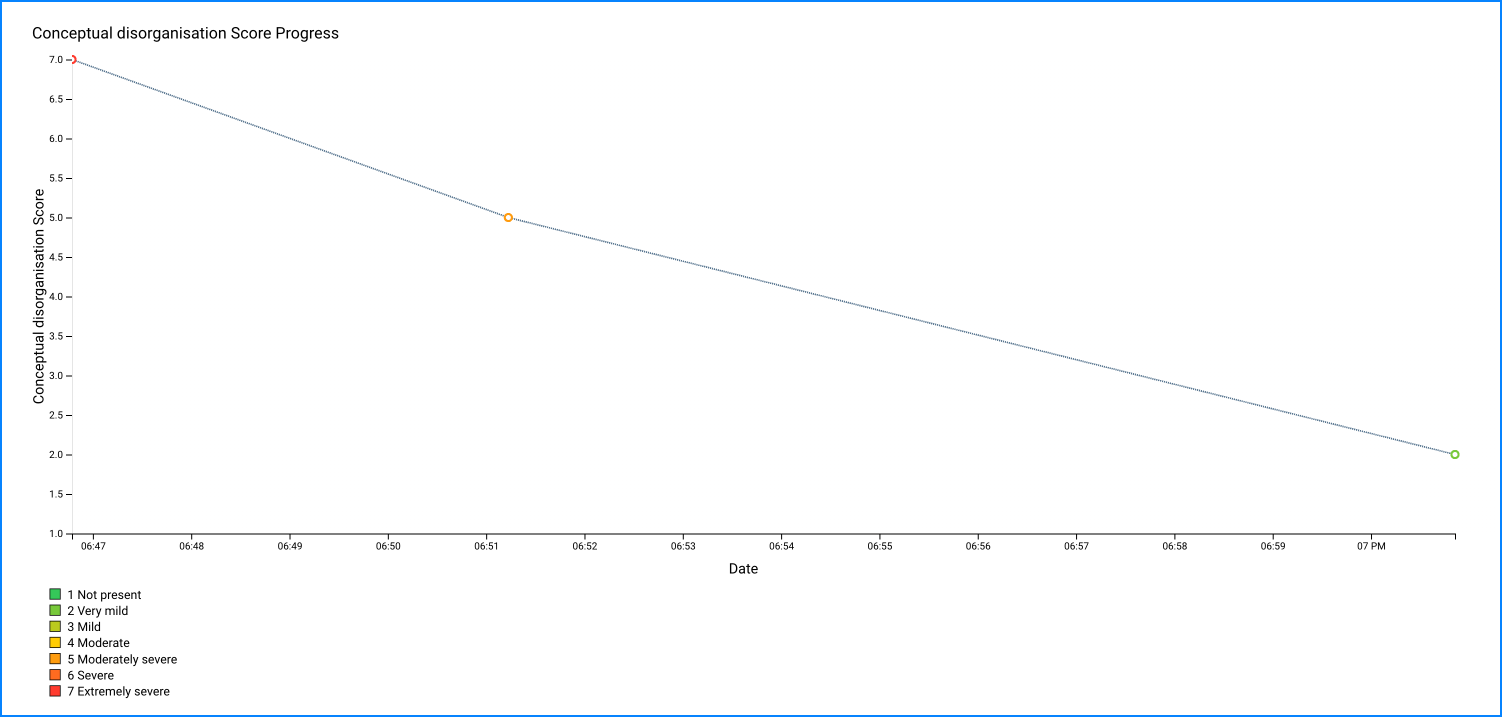
Graphing of symptomatology can provide vivid representations of the relationships between specific types of symptoms (e.g., hallucinations) and other variables of interest, such as (1) medication type and dose, (2) changes in psychosocial treatment and rehabilitation programs, (3) the use of "street" drugs or alcohol, (4) life events, and (5) other environmental or familial stressors. Repeated measurement and graphing of symptoms over time can be done for individual items (e.g., anxiety or hallucinations), or for clusters of symptoms (e.g., psychotic index). Such clusters can be chosen from factor analyses of earlier versions of the BPRS (Guy, 1976; Overall, Hollister, and Pichot, 1967; Overall and Porterfield, 1963).


