The BART was designed to provide a context in which actual risky behavior could be examined. The BART was presented on the computer in the experimental room. Specifically, the computer screen showed a small simulated balloon accompanied by a balloon pump, a reset button labeled Collect $$$, a permanent money-earned display labeled Total Earned, and a second display listing the money earned on the last balloon and labeled Last Balloon.
Each click on the pump inflated the balloon 1° (about 0.125 in. [0.3 cm] in all directions). With each pump, 5 cents were accrued in a temporary reserve (the amount of money in this reserve is never indicated to the participant). When a balloon was pumped past its individual explosion point, a “pop” sound effect was generated from the computer. When a balloon exploded, all money in the temporary bank was lost, and the next uninflated balloon appeared on the screen. At any point during each balloon trial, the participant could stop pumping the balloon and click the Collect $$$ button. Clicking this button would transfer all money from the temporary bank to the permanent bank, during which the new total earned would be incrementally updated cent by cent while a slot machine payoff sound effect played.
After each balloon explosion or money collection, the participant’s exposure to that balloon ended, and a new balloon appeared until a total of 30 balloons (i.e., trials) had been completed.
Participants were given no detailed information about the probability of an explosion. They were told that at some point each balloon would explode and that this explosion could occur as early as the first pump all the way up to the point at which the balloon had expanded to fill the entire computer screen.
The probability that a balloon would explode was arranged by constructing an array of N numbers. The number 1 was designated as indicating a balloon explosion. On each pump of the balloon, a number was selected without replacement from the array. The balloon exploded if the number 1 was selected. For example, the array for balloons contained the integers 1–128. Thus, the probability that a balloon would explode on the first pump was 1/128. If the balloon did not explode after the first pump, the probability that the balloon would explode was 1/127 on the second pump, 1/126 on the third pump, and so on up until the 128th pump, at which the probability of an explosion was 1/1 (i.e., 100%). According to this algorithm, the average break point would be 64 pumps. Modeling real-world situations in which excessive risk often results in diminishing returns and increasing health and safety threats, each successive pump on any particular balloon trial (a) increased the amount to be lost because of an explosion and (b) decreased the relative gain of any additional pump. For example, after the first pump the next pump risks only the 5 cents accrued in the temporary bank and would increase the possible earnings on that balloon by 100%, yet after the 60th pump the next pump risks $3 accrued in the temporary bank and would increase possible earnings on that balloon trial only by 1.6%.
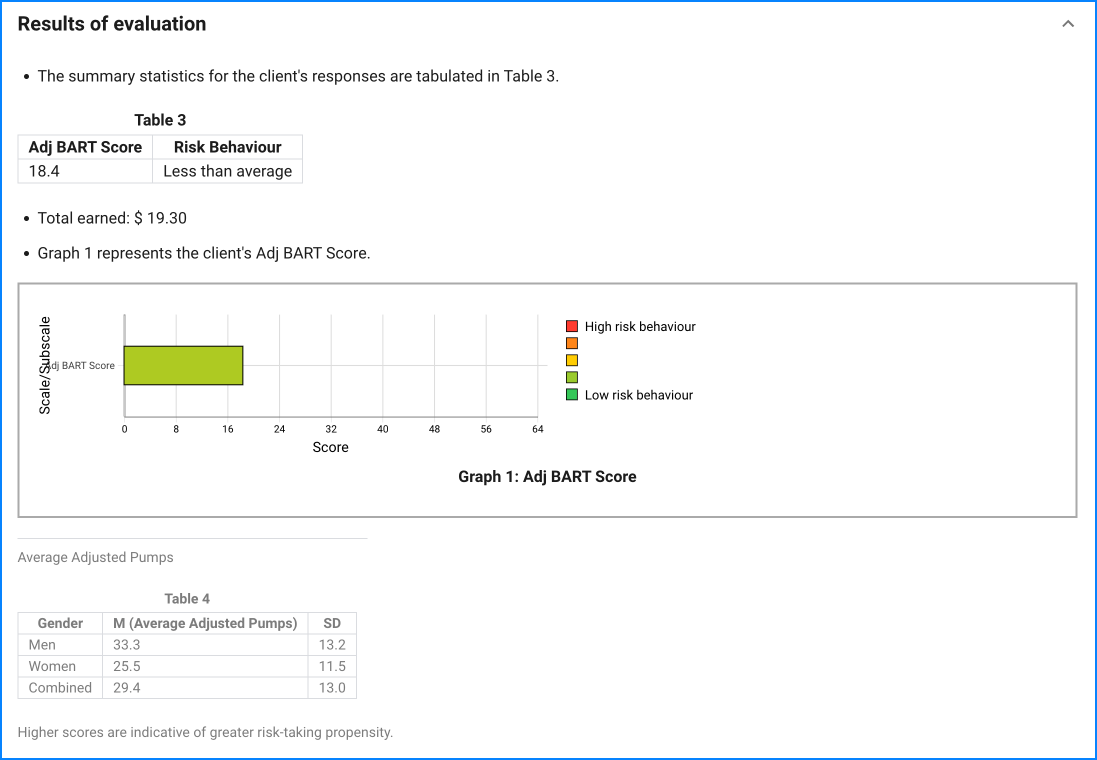
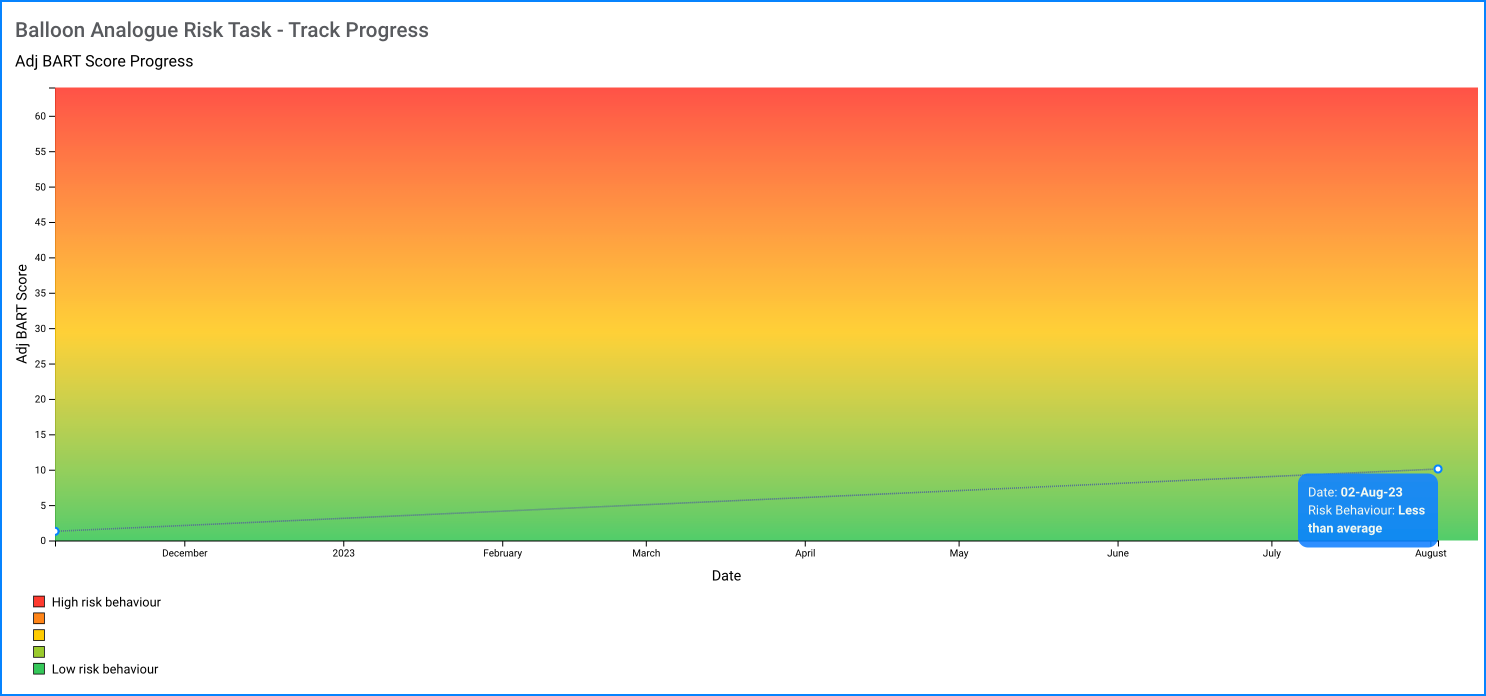
The number of pumps on the balloon served as the primary dependent measure. Instead of using an absolute average number of pumps, however, authors decided a priori to use only adjusted values for their analyses. These adjusted values, defined as the average number of pumps excluding balloons that exploded (i.e., the average number of pumps on each balloon prior to money collection), were preferable because the number of pumps was necessarily constrained on balloons that exploded, thereby limiting between subjects variability in the absolute averages.


